Atomic Spectra

Light and Atomic Spectra
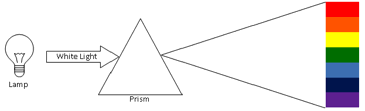
In the 1670s, Isaac Newton, during optical experiments observed that a beam of white light was decomposed in a continuum spectrum of all visible colors, like a rainbow, when it pass through a prism. Newton classified this spectrum in a range of seven different colors (Red, Orange, Yellow, Green, Bleu, Indigo and Violet). In sequence of this experiment, Newton combined those colored beams in another prism which resulted in another white light beam. This means that the white light is formed by the combination all visible colors. The decomposition of the white light in different colors results from different wavelengths, as a consequence, they move at different speeds in the prism, with red light moving faster than violet. The result is that red light bends less sharply than violet as it passes through the prism, creating a spectrum of colors. The table below shows the range of wavelength for each of seven colors of the rainbow.
| Color | Wavelength (nm) |
|---|---|
| Red | 620 -750 |
| Orange | 590 – 620 |
| Yellow | 570 – 590 |
| Green | 495 – 570 |
| Blue | 450 – 500 |
| Indigo | 420 – 450 |
| Violet | 380 – 420 |
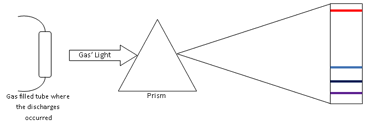
In the 19th century, scientist discovered that they could use the light emitted by heated or electrical discharged materials to analyze their properties. This was the beginning of the Spectrum Analyze Technique. In 1850s, Anders Jonas Angstrom observed that the light emitted by a high heated gas did not have a continuum spectrum, like white light, when it passes through a prism. The spectrum of the heated gas was discrete lines or spectra lines. This means that a heated gas emits light in just some specific wavelength. Scientist found that each element of periodic table has a unique set of spectral lines, as a signature of the element. That way, it is possible to use the spectrum analyze to identify the composition of material. This is a technique very important in astronomy where scientists use to analyze the properties of distant objects, like their chemical elements.
The specific wavelengths emitted by the gas are related to their atomic structure. As well known, the atom is compounded by a nucleus with positive (protons) and neutral (neutrons) charges surrounded by a cloud of negative charges (electrons). The electrons of an atom are bounded to the nucleus by the electromagnetic force. By the quantum mechanical theory, a bounded electron can only occupy a set of states centered on the nucleus, and each state corresponds to a specific energy level. When an electron is excited, by heart or electrical discharge, it jumps to a higher energy level. However, the electron tends to be in the lowest unoccupied energy level available. That way, the electron returns to its original state. To the electron fall back, it emits an amount of energy in form of light (photon) with a specific wavelength. This energy is equal the difference between the excited and the original level. In conclusion, the spectra lines are result of the energy quantization of the atom.
As each element has different energy levels of their atoms, we can identify elements by their spectra lines. The table below shows the wavelength to the two strongest lines emitted on the visible spectrum by the gases of hydrogen (H), Argon (Ar), neon (Ne) and helium (He), the gases which fill the tubes on this experiment.
| Element | Wavelength (nm) of strongest lines on visible spectrum | |
|---|---|---|
| Hydrogen | 656 | 486 |
| Argon | 707 | 696 |
| Neon | 585 | 640 |
| Helium | 588 | 389 |
TO DO:
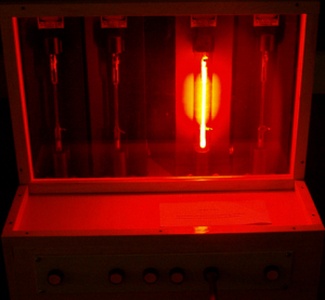
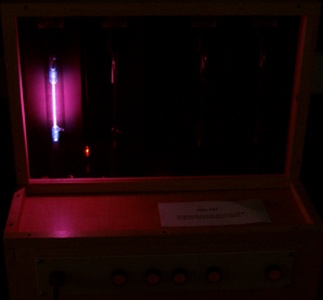
- Press the red bottom on the center to turn on the white light. Hold a piece of grating in front of your eyes and look its spectra.
- Press others red bottom to turn on the gas filled tubes. Hold a piece of grating to look the spectra of each gas. Compare their two strongest spectrum lines with those shown on the table above.
- Compare the spectra of each gas filled tubes with the elements spectra line table shown nearby.